Home / Press
Press and data · The Northern Lights Odds 2026–27
In February at Abisko, 7.8 in 10 four-night stays had a clear, dark night with the aurora active
Abisko · February7.8in 10 four‑night stays
Across 7 winters at Abisko, 7.8 in 10 four-night stays starting in February contained at least one clear, dark night with the aurora active. It is the highest four-night figure of the four bases we count. The four bases cover different winters (Abisko 7, the others 10). A record of past winters, not a promise for any one night. Free to quote and republish with a credit and a link to Northern Lights Escapes.
Data, charts and citationChecked October 2026
Three-night stays with a clear, dark night and the aurora active, in 10
Four bases, September to April. Share of past three-night trip windows that contained at least one good night.
Brightest bar: the best month at that base. Dashed line: 5 in 10. A record of past winters, not a promise for any one night.
Abisko
Winters used: 7 (2019-20, 2020-21, 2021-22, 2022-23, 2023-24, 2024-25, 2025-26), September to April. Not ten: SMHI's hourly cloud series at Abisko starts in June 2019, so these are all the complete winters with hourly cloud and Kp together. Treat the table as seven winters of evidence, not a long-run climate average.
- In February at Abisko, about 7.8 in 10 four-night stays over the last 7 winters had at least one clear, dark night with the aurora active (single winters ranged from 56% to 96%).
- In December, about 5.9 in 10 three-night stays had one, and about 3.3 in 10 single nights.
- In April, even a five-night stay had at least one such night only about 2.4 in 10 times, because the nights are already too light.
Every month, lit up
Three-night stays. Each row is ten stays; lit dots are rounded to the nearest whole dot, the exact figure is on the right.
- Sep4.5 in 10
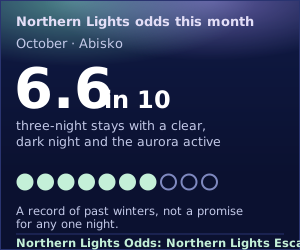
- Oct6.6 in 10
- Nov6.7 in 10
- Dec5.9 in 10
- Jan6.8 in 10
- Feb7.0 in 10
- Mar5.3 in 10
- Apr2.0 in 10
| Start month | 1 night | 2 nights | 3 nights | 4 nights | 5 nights | Single winters, 3 nights (in 10) |
|---|---|---|---|---|---|---|
| Sep | 21% (180) | 34% (180) | 45% (180) | 55% (180) | 61% (180) | 2.0 to 6.0 |
| Oct | 33% (216) | 52% (216) | 66% (216) | 76% (216) | 83% (216) | 4.5 to 8.1 |
| Nov | 35% (207) | 54% (204) | 67% (201) | 76% (198) | 83% (195) | 5.0 to 8.7 |
| Dec | 33% (191) | 49% (190) | 59% (189) | 66% (188) | 72% (187) | † to 8.1 |
| Jan | 40% (202) | 56% (202) | 68% (202) | 77% (202) | 84% (202) | † to 9.7 |
| Feb | 38% (195) | 58% (192) | 70% (189) | 78% (186) | 85% (183) | 4.2 to 9.3 |
| Mar | 24% (216) | 40% (215) | 53% (214) | 61% (213) | 68% (212) | 1.9 to 9.0 |
| Apr | 10% (210) | 15% (210) | 20% (210) | 23% (210) | 24% (210) | 0.0 to 3.7 |
Share of past trip windows (starting in that month) with at least one good night. Good night = at least 2 hours that were dark (sun more than 12 degrees below the horizon), clear (cloud 25% or less, 2 oktas) and active (Kp 2 or more). Windows counted in brackets. September and April include nights too light to see the aurora at all (counted as not good), which is why they are low.
† A single winter's month can have only a few usable nights; ranges resting on fewer than 20 windows are left out.
September at Abisko rests on 6 Septembers (2019-20 had no usable nights).
Abisko: method, station and limits
Method in five lines
- A night runs local noon to noon (Europe/Stockholm); dark means the sun more than 12 degrees below the horizon at 68.35 N, 18.83 E.
- Each hourly SMHI cloud reading at Abisko Aut (station 188790) must be 25% or less; 113 (sky obscured) counts as cloudy.
- Each hour takes the Kp of its 3-hour GFZ block, which must be 2 or more; Abisko sits under the aurora oval, so Kp 2 is a low bar for activity, not a guarantee of a show.
- A night is good with at least 2 such hours; a trip window of k nights is a success if any of its nights is good, over every start date in September to April.
- A night with any missing dark-period hour is excluded, and so is any window containing it. Gaps are never filled.
What this table can and cannot say
- Cloud is the Abisko Aut station reading, in the Abisko valley. A trip that drives or walks to clearer sky may do better; one that stays in cloud will not.
- Kp is a planet-wide index. Kp 2 or more marks a night with some geomagnetic activity. It is not a sighting record, and we do not claim how bright the aurora was.
- Seven winters is a short record, and they run from the minimum to near the peak of the 11-year solar cycle. Geomagnetic activity tends to be higher near the peak. The by-winter file shows the early winters well below the later ones. A quieter stretch of the cycle would likely give lower figures. This is the expectation, not something this data shows.
- Past windows describe the past. They are not a forecast for any given trip.
Independent check
Independent check by a reviewer who read only the method (spec.md and the method section above), not odds.py. Run on the raw files in data/raw/ (SMHI 188790 cloud, GFZ Kp).
Different sun method. Astronomical Almanac low-precision sun position (not the NOAA-style formula), dark = sun below -12 degrees. Reference: sunrise-sunset.org API (Abisko 68.35 N, 18.83 E, one request per date, UTC), nautical twilight (= -12 degrees). timeanddate.com answered 403 to a plain fetch and was not pursued or routed round.
| Date | Nautical begin: mine / reference | Nautical end: mine / reference |
|---|---|---|
| 2026-02-15 | 04:57 / 04:55:23 | 17:04 / 17:02:08 |
| 2025-10-15 | 03:47 / 03:47:48 | 17:12 / 17:13:00 |
Within about 2 minutes (mine is found to the whole minute). That is well inside what could move an hourly count.
Cell-by-cell result. 100 cells compared: the full main table (8 months x 5 lengths, 40 cells) and the February and December rows of every sensitivity variant (60 cells). Maximum absolute difference 0.6 percentage points. No cell differs by more than 2 points. Every window count (n) matches exactly, and usable nights per month match the table above exactly. The only visible differences are one-night shifts in a handful of cells (for example Sep 1 night: 21.1% mine vs 20.6% builder, one night in 180, from a marginal twilight hour on the 12-degree line).
Other checks.
- The three plain-English sentences are true to the table: Feb 4 nights 78.5% (7.8 in 10); winter range for that cell 56% (2019-20) to 96% (2025-26); Dec 3 nights 58.7% (5.9 in 10) and 1 night 33.0% (3.3 in 10); Apr 5 nights 24.3% (2.4 in 10).
- The "about 80% over three nights" comparison is fair. Recomputed: Oct to Mar three-night windows 63.7% (1211 windows), monthly 53% to 70%; loosest definition 92.7%; cloud-only loosening 70.7%; Kp-only loosening 79.8%. It states the figure is the operator's, undefined to us, and labels the comparison unverified. It does not call the operator wrong.
- The solar-cycle caveat is worded as an expectation ("tends to be", "would likely", "the expectation, not something this data shows"). One wording note: "they fall around the peak" is loose. 2019-20 sits near the cycle minimum, and the winters run from minimum to near maximum. Suggest "they run from the minimum to near the peak of the 11-year solar cycle". The by-winter spread (Feb 4 nights 56% rising to 96%) supports the point but is not proof of cause, and the text already says so.
- Credits: SMHI (CC BY 4.0 SE, modified) and GFZ (CC BY 4.0, doi:10.5880/Kp.0001, modified) are present. No sunspot data is used: the GFZ files hold only Kp, datetime, status and meta.
Verdict: CONFIRMED WITH NOTES. The numbers reproduce. The one note is the cycle-phase wording in item 3. Limits of this check: it re-implements the same method definition (a wrong definition would repeat in both), and it uses the same two raw files, so it does not test the downloads themselves.
Usable nights per month
| Month | Usable nights | Nights in record | Excluded for missing data |
|---|---|---|---|
| Sep | 180 | 210 | 30 |
| Oct | 216 | 217 | 1 |
| Nov | 207 | 210 | 3 |
| Dec | 191 | 217 | 26 |
| Jan | 202 | 217 | 15 |
| Feb | 195 | 198 | 3 |
| Mar | 216 | 217 | 1 |
| Apr | 210 | 210 | 0 |
Tromsø
Winters used: 10 (2016-17, 2017-18, 2018-19, 2019-20, 2020-21, 2021-22, 2022-23, 2023-24, 2024-25, 2025-26), September to April. Ten is the most the method uses, and the Langnes record is almost complete for the latest ten winters (the cloud record we pulled starts in August 2015). Treat the table as ten winters of evidence, not a long-run climate average.
- In February at Tromsø, about 7.2 in 10 four-night stays over the last 10 winters had at least one clear, dark night with the aurora active (single winters ranged from roughly half to all of them).
- In December, about 6.5 in 10 three-night stays had one, and about 3.8 in 10 single nights.
- In April, even a five-night stay had at least one such night only about 1.6 in 10 times, because the nights are already too light.
Every month, lit up
Three-night stays. Each row is ten stays; lit dots are rounded to the nearest whole dot, the exact figure is on the right.
- Sep4.5 in 10
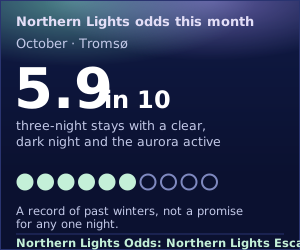
- Oct5.9 in 10
- Nov6.3 in 10
- Dec6.5 in 10
- Jan6.2 in 10
- Feb6.4 in 10
- Mar5.1 in 10
- Apr1.4 in 10
| Start month | 1 night | 2 nights | 3 nights | 4 nights | 5 nights | Single winters, 3 nights (in 10) |
|---|---|---|---|---|---|---|
| Sep | 20% (299) | 34% (297) | 45% (295) | 55% (293) | 63% (291) | 2.3 to 8.4 |
| Oct | 29% (303) | 47% (297) | 59% (291) | 68% (285) | 75% (278) | 4.5 to 8.2 |
| Nov | 31% (296) | 49% (291) | 63% (285) | 72% (279) | 78% (274) | 3.7 to 8.3 |
| Dec | 38% (296) | 54% (286) | 65% (277) | 73% (268) | 79% (261) | † to 8.7 |
| Jan | 32% (299) | 49% (290) | 62% (282) | 70% (275) | 77% (268) | 4.2 to 9.3 |
| Feb | 37% (265) | 52% (255) | 64% (245) | 72% (236) | 79% (229) | 5.0 to † |
| Mar | 24% (301) | 39% (293) | 51% (284) | 61% (276) | 70% (268) | 2.6 to † |
| Apr | 7% (294) | 11% (290) | 14% (289) | 16% (288) | 16% (287) | 0.0 to 3.0 |
Share of past trip windows (starting in that month) with at least one good night. Good night = at least 2 hours that were dark (sun more than 12 degrees below the horizon), clear (cloud 25% or less, 2 oktas) and active (Kp 2 or more). Windows counted in brackets. September and April include nights too light to see the aurora at all (counted as not good), which is why they are low.
† A single winter's month can have only a few usable nights; ranges resting on fewer than 20 windows are left out.
Tromsø: method, station and limits
Method in five lines
- A night runs local noon to noon (Europe/Oslo); dark means the sun more than 12 degrees below the horizon at 69.65 N, 18.96 E (Tromsø).
- Each hourly MET Norway cloud reading at Tromsø-Langnes airport, station SN90490, must be 25% or less (2 oktas or fewer); the source reports oktas, so 1 okta = 12.5% and 2 = 25%; a reading of 9 (sky obscured) counts as cloudy.
- Each hour takes the Kp of its 3-hour GFZ block, which must be 2 or more; Kp 2 is a low bar for activity, not a guarantee of a show.
- A night is good with at least 2 such hours; a trip window of k nights is a success if any of its nights is good, over every start date in September to April.
- A night with any missing dark-period hour is excluded, and so is any window containing it. Gaps are never filled.
The station
Cloud comes from Tromsø-Langnes airport, MET Norway station SN90490 (69.6767 N, 18.9133 E), about 3 km from Tromsø. It is the airport, on the same island as the town. The weather station in the town itself (SN90450) reports total cloud only every 6 hours, which is too sparse for an hourly method, so it was not used. Langnes has reported hourly cloud since 2007. About 8% of its hourly readings are 9 (sky obscured), which counts as cloudy. Winter rule: a winter is used only if at least 80% of its September to April nights are usable (no missing dark-period hour). All ten passed; the lowest, 2017-18, had 91.7% usable.
What this table can and cannot say
- Cloud is one station's reading, 3 km from Tromsø. Tromsø sits on an island among fjords and mountains, and the airport is on the same island, so cloud on a trip that drives inland or north can differ from the airport's in either direction. This table does not measure that.
- Kp is a planet-wide index. Kp 2 or more marks a night with some geomagnetic activity. It is not a sighting record, and we do not claim how bright the aurora was.
- Ten winters is a short record, and they run from the declining years of the last 11-year solar cycle, through its minimum around 2019, to near the peak of the current one. Geomagnetic activity tends to be higher near the peak. For three-night windows from October to March, the by-winter file has 2018-19 lowest at 49% and 2025-26 highest at 76%. A quieter stretch of the cycle would likely give lower figures. This is the expectation, not something this data shows.
- At about 70 N, September and April are the months most sensitive to the sun formula: the sun sits only just below the 12 degree line for part of those nights, so a few minutes of error in the dark-hours count can move a night in or out. The independent check for Tromsø (below) moved September by up to about 3 points and February by up to about 1.3, all traced to nights where the sun sits within 0.2 degrees of the 12 degree line. Read September and April as soft, and the main table as accurate to a few points.
- Past windows describe the past. They are not a forecast for any given trip.
Independent check
The check was done by an independent reviewer who read only the method, not odds.py. They wrote their own code, used the Astronomical Almanac sun position, and ran it on the same raw files.
- Main table: the largest difference was 3.1 points, in September. February moved by 0.8 to 1.3 points and every other month by 0.5 points or less.
- Sensitivity table (Feb and Dec rows): the largest difference was 2.2 points.
- Why the figures differ: every difference traces to a night when the sun was within 0.05 to 0.17 degrees of the 12 degree line.
- Window counts: all match except March, where usable nights came to 302 against 301.
- Single-winter range for Feb 4 nights: 61% to 100% here and 50% to 100% in the check. The 2022-23 winter turns on one borderline night, so the sentence now says "roughly half to all".
- Alta: the blocked reason was confirmed from Frost's own series list.
- Client ID: not present in any file.
Verdict: CONFIRMED WITH NOTES. Both notes have been applied.
Usable nights per month
| Month | Usable nights | Nights in record | Excluded for missing data |
|---|---|---|---|
| Sep | 299 | 300 | 1 |
| Oct | 303 | 310 | 7 |
| Nov | 296 | 300 | 4 |
| Dec | 296 | 310 | 14 |
| Jan | 299 | 310 | 11 |
| Feb | 265 | 282 | 17 |
| Mar | 301 | 310 | 9 |
| Apr | 294 | 300 | 6 |
Rovaniemi
Winters used: 10 (2016-17, 2017-18, 2018-19, 2019-20, 2020-21, 2021-22, 2022-23, 2023-24, 2024-25, 2025-26), September to April. Ten is the most the method uses, and the Rovaniemi record is almost complete for the latest ten winters (the cloud record we pulled starts in August 2015). Treat the table as ten winters of evidence, not a long-run climate average. A winter counts only if at least 80% of its September to April nights have usable cloud data; the latest ten that pass are used.
- In February at Rovaniemi, about 6.6 in 10 four-night stays over the last 10 winters had at least one clear, dark night with the aurora active (single winters ranged from 41% to 82%).
- In December, about 4 in 10 three-night stays had one, and about 2 in 10 single nights.
- In April, even a five-night stay had at least one such night only roughly 4 in 10 times, because the nights are already too light.
Every month, lit up
Three-night stays. Each row is ten stays; lit dots are rounded to the nearest whole dot, the exact figure is on the right.
- Sep4.1 in 10
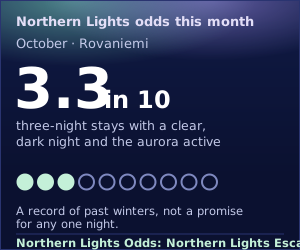
- Oct3.3 in 10
- Nov3.1 in 10
- Dec4.0 in 10
- Jan5.0 in 10
- Feb5.8 in 10
- Mar6.0 in 10
- Apr3.3 in 10
| Start month | 1 night | 2 nights | 3 nights | 4 nights | 5 nights | Single winters, 3 nights (in 10) |
|---|---|---|---|---|---|---|
| Sep | 19% (299) | 32% (298) | 41% (297) | 49% (296) | 56% (295) | 2.3 to 7.3 |
| Oct | 16% (308) | 27% (305) | 33% (301) | 37% (297) | 40% (293) | 0.7 to 9.2 |
| Nov | 15% (293) | 23% (286) | 31% (281) | 39% (276) | 46% (272) | 1.0 to 6.2 |
| Dec | 20% (306) | 31% (302) | 40% (298) | 47% (294) | 52% (290) | 0.0 to 8.3 |
| Jan | 24% (302) | 39% (296) | 50% (290) | 58% (285) | 65% (280) | 1.0 to 8.1 |
| Feb | 29% (277) | 46% (271) | 58% (265) | 66% (262) | 71% (259) | 3.5 to 7.1 |
| Mar | 32% (305) | 50% (301) | 60% (297) | 68% (293) | 74% (289) | 1.8 to 8.1 |
| Apr | 18% (299) | 27% (298) | 33% (297) | 38% (296) | 41% (295) | 2.3 to 5.3 |
Share of past trip windows (starting in that month) with at least one good night. Good night = at least 2 hours that were dark (sun more than 12 degrees below the horizon), clear (cloud 25% or less, 2 oktas) and active (Kp 2 or more). Windows counted in brackets. September and April include nights too light to see the aurora at all (counted as not good), which is why they are low. At this latitude the sun only just clears the 12-degree line in those months, so September and April figures can move a few points with the sun formula used (up to about 5 points in the independent check); treat them as rough.
† A single winter's month can have only a few usable nights; ranges resting on fewer than 20 windows are left out.
Rovaniemi: method, station and limits
Method in five lines
- A night runs local noon to noon (Europe/Helsinki); dark means the sun more than 12 degrees below the horizon at 66.5 N, 25.73 E (Rovaniemi).
- Each hourly FMI cloud reading at Rovaniemi railway station, station 101928, must be 25% or less (2 oktas or fewer); the source reports oktas, so 1 okta = 12.5% and 2 = 25%; a reading of 9 (sky obscured) counts as cloudy.
- Each hour takes the Kp of its 3-hour GFZ block, which must be 2 or more; Kp 2 is a low bar for activity, not a guarantee of a show.
- A night is good with at least 2 such hours; a trip window of k nights is a success if any of its nights is good, over every start date in September to April.
- A night with any missing dark-period hour is excluded, and so is any window containing it. Gaps are never filled.
The station
Cloud comes from Rovaniemi railway station, FMI station 101928 (66.4983 N, 25.7088 E), about 1 km from Rovaniemi. It is the FMI station in the town itself, and the nearest to the town centre with an hourly cloud record. The airport's automatic station (137190), 8 km from the centre, was the first choice, but it has almost no hourly cloud for the winters 2017-18 and 2018-19, so it could not give a full run of winters. As a cross-check, over the 8 winters where both stations have a usable record, three-night windows from October to March had a good night 47.1% of the time on this station's cloud and about 47% on the airport's (47.5% here, 47.2% in the independent check) (1,368 and 1,394 windows), so the choice of station does not move the headline.
What this table can and cannot say
- Cloud is one station's reading, 1 km from Rovaniemi. Town-centre light and a river valley are not measured here; a trip that leaves town for darker sky may see different cloud.
- Kp is a planet-wide index. Kp 2 or more marks a night with some geomagnetic activity. It is not a sighting record, and we do not claim how bright the aurora was.
- Ten winters is a short record, and they run from the declining years of the last 11-year solar cycle, through its minimum around 2019, to near the peak of the current one. Geomagnetic activity tends to be higher near the peak. For three-night windows from October to March, the by-winter file has 2020-21 lowest at 31% and 2024-25 highest at 74%. A quieter stretch of the cycle would likely give lower figures. This is the expectation, not something this data shows.
- Past windows describe the past. They are not a forecast for any given trip.
Independent check
An independent reviewer read only the method (not odds.py). They used their own code with the Astronomical Almanac sun position and the same raw files.
- Window counts and usable nights match on every cell.
- In October to March the cells agree closely. In September and April they differ by up to 4.7 points, because of how sensitive the sun formula is at 66.5 N. For example, April 5 nights is 41.0% here and 36.3% in the check.
- Twilight times are within 4 minutes of sunrise-sunset.org on two dates.
- The plain-English sentences and the single-winter range (41% to 82%) are confirmed.
- Verdict: CONFIRMED WITH NOTES. The notes have been applied: the April sentence is now rounded, the shoulder-month caveat is added, and the winter rule is stated.
Usable nights per month
| Month | Usable nights | Nights in record | Excluded for missing data |
|---|---|---|---|
| Sep | 299 | 300 | 1 |
| Oct | 308 | 310 | 2 |
| Nov | 293 | 300 | 7 |
| Dec | 306 | 310 | 4 |
| Jan | 302 | 310 | 8 |
| Feb | 277 | 282 | 5 |
| Mar | 305 | 310 | 5 |
| Apr | 299 | 300 | 1 |
Saariselkä
Winters used: 10 (2016-17, 2017-18, 2018-19, 2019-20, 2020-21, 2021-22, 2022-23, 2023-24, 2024-25, 2025-26), September to April. Ten is the most the method uses, and the Ivalo record is almost complete for the latest ten winters (the cloud record we pulled starts in August 2015). Treat the table as ten winters of evidence, not a long-run climate average. A winter counts only if at least 80% of its September to April nights have usable cloud data; the latest ten that pass are used.
- In February at Saariselkä, about 6.9 in 10 four-night stays over the last 10 winters had at least one clear, dark night with the aurora active (single winters ranged from 54% to 82%).
- In December, about 4.9 in 10 three-night stays had one, and about 2.5 in 10 single nights.
- In April, even a five-night stay had at least one such night only about 2.1 in 10 times, because the nights are already too light.
Every month, lit up
Three-night stays. Each row is ten stays; lit dots are rounded to the nearest whole dot, the exact figure is on the right.
- Sep3.5 in 10
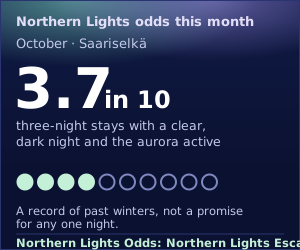
- Oct3.7 in 10
- Nov3.7 in 10
- Dec4.9 in 10
- Jan5.5 in 10
- Feb5.9 in 10
- Mar5.7 in 10
- Apr1.7 in 10
| Start month | 1 night | 2 nights | 3 nights | 4 nights | 5 nights | Single winters, 3 nights (in 10) |
|---|---|---|---|---|---|---|
| Sep | 15% (300) | 26% (300) | 35% (300) | 42% (300) | 48% (300) | 1.3 to 6.7 |
| Oct | 18% (310) | 28% (310) | 37% (309) | 43% (308) | 49% (307) | 0.3 to 7.7 |
| Nov | 17% (299) | 29% (298) | 37% (298) | 44% (298) | 51% (298) | 0.0 to 7.7 |
| Dec | 25% (310) | 38% (310) | 49% (310) | 57% (310) | 64% (310) | 1.0 to 8.1 |
| Jan | 30% (310) | 45% (310) | 55% (310) | 66% (310) | 74% (310) | 2.3 to 8.1 |
| Feb | 29% (282) | 46% (282) | 59% (282) | 69% (282) | 76% (282) | 3.9 to 7.9 |
| Mar | 28% (310) | 46% (310) | 57% (310) | 65% (310) | 71% (310) | 2.6 to 8.1 |
| Apr | 8% (300) | 14% (300) | 17% (300) | 20% (300) | 21% (300) | 0.0 to 4.0 |
Share of past trip windows (starting in that month) with at least one good night. Good night = at least 2 hours that were dark (sun more than 12 degrees below the horizon), clear (cloud 25% or less, 2 oktas) and active (Kp 2 or more). Windows counted in brackets. September and April include nights too light to see the aurora at all (counted as not good), which is why they are low.
† A single winter's month can have only a few usable nights; ranges resting on fewer than 20 windows are left out.
Saariselkä: method, station and limits
Method in five lines
- A night runs local noon to noon (Europe/Helsinki); dark means the sun more than 12 degrees below the horizon at 68.42 N, 27.41 E (Saariselkä).
- Each hourly FMI cloud reading at Ivalo airport, station 102033, must be 25% or less (2 oktas or fewer); the source reports oktas, so 1 okta = 12.5% and 2 = 25%; a reading of 9 (sky obscured) counts as cloudy.
- Each hour takes the Kp of its 3-hour GFZ block, which must be 2 or more; Kp 2 is a low bar for activity, not a guarantee of a show.
- A night is good with at least 2 such hours; a trip window of k nights is a success if any of its nights is good, over every start date in September to April.
- A night with any missing dark-period hour is excluded, and so is any window containing it. Gaps are never filled.
The station
Cloud comes from Ivalo airport, FMI station 102033 (68.6134 N, 27.4189 E), about 22 km from Saariselkä. Saariselkä has no FMI station reporting hourly cloud: the two stations at the resort (the tourist centre and Kaunispää) returned no cloud values in the checks we ran. Ivalo airport is the nearest FMI station that does, and it is to the north of the resort.
What this table can and cannot say
- Cloud is one station's reading, 22 km from Saariselkä. Saariselkä sits among fells and Ivalo airport does not, so cloud at the resort can differ from the airport's in either direction. This table does not measure that.
- Kp is a planet-wide index. Kp 2 or more marks a night with some geomagnetic activity. It is not a sighting record, and we do not claim how bright the aurora was.
- Ten winters is a short record, and they run from the declining years of the last 11-year solar cycle, through its minimum around 2019, to near the peak of the current one. Geomagnetic activity tends to be higher near the peak. For three-night windows from October to March, the by-winter file has 2020-21 lowest at 30% and 2024-25 highest at 72%. A quieter stretch of the cycle would likely give lower figures. This is the expectation, not something this data shows.
- Past windows describe the past. They are not a forecast for any given trip.
Independent check
An independent reviewer read only the method (not odds.py). They used their own code with the Astronomical Almanac sun position and the same raw files.
- The largest difference anywhere is 1.7 points in the main table and 1.0 points in the sensitivity rows.
- Window counts and usable nights match on every cell.
- The plain-English sentences and the single-winter range (54% to 82%) are confirmed.
- Verdict: CONFIRMED WITH NOTES. The one note was to state the winter-inclusion rule, and that is now done.
Usable nights per month
| Month | Usable nights | Nights in record | Excluded for missing data |
|---|---|---|---|
| Sep | 300 | 300 | 0 |
| Oct | 310 | 310 | 0 |
| Nov | 299 | 300 | 1 |
| Dec | 310 | 310 | 0 |
| Jan | 310 | 310 | 0 |
| Feb | 282 | 282 | 0 |
| Mar | 310 | 310 | 0 |
| Apr | 300 | 300 | 0 |
Alta
Not built. There is no usable hourly cloud record for Alta, so there is no table.
The method needs an observation for every dark hour of a night, and a night with a missing dark hour is excluded and never filled. A 6-hourly record leaves five of every six hours missing, so almost every night would be excluded. Alta is therefore left out rather than estimated from a base with a different climate.
For journalists
Data
Every table on this page: one row per base, start month and stay length, with the number of past windows behind it. Winter-by-winter results (CSV).
Charts
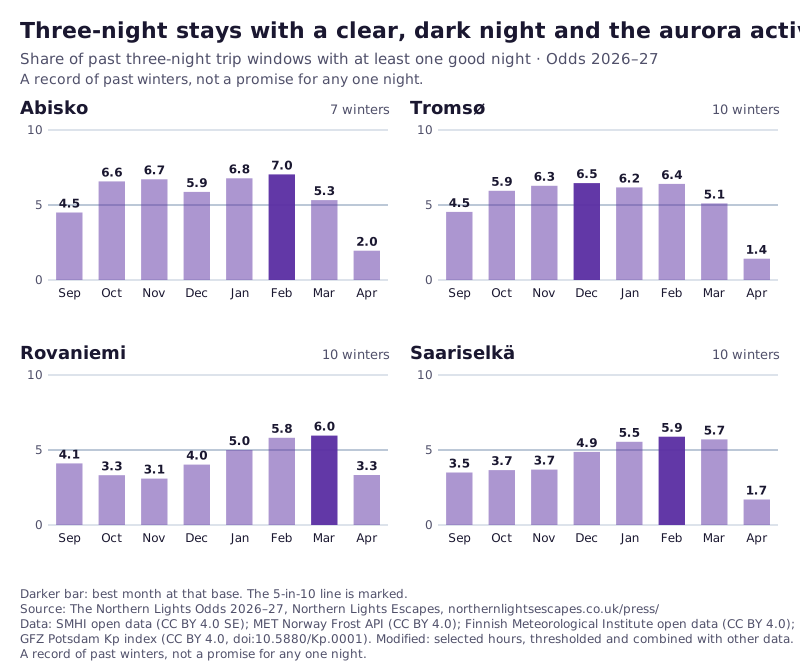 Download chart: odds by month, four bases
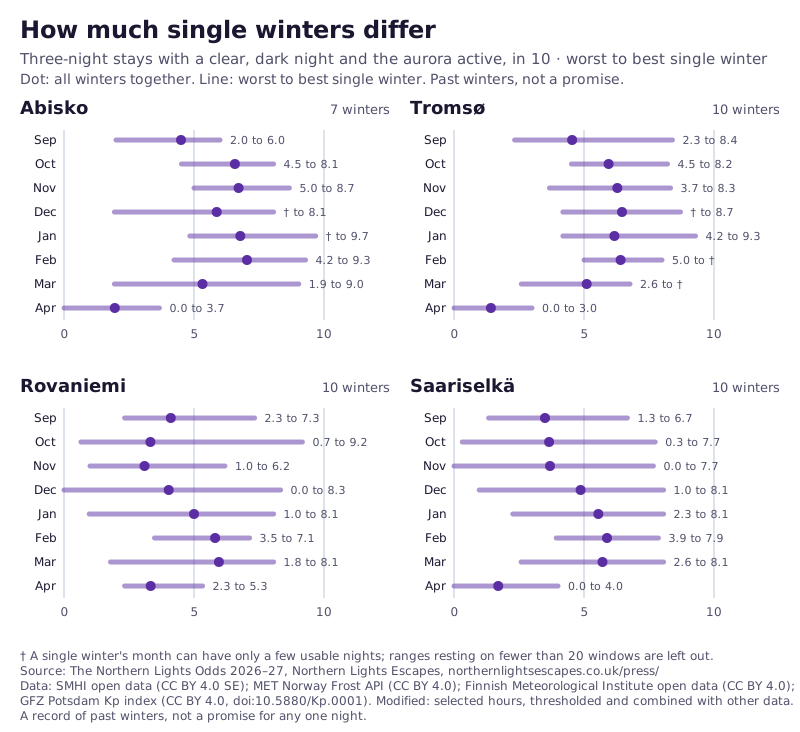 Download chart: how much winters differ
Quoting this
Source: The Northern Lights Odds 2026–27, Northern Lights Escapes, northernlightsescapes.co.uk/press/
Free to quote and republish with a credit and a link to Northern Lights Escapes. Use the charts and CSV as they stand; each chart prints its source line. Credits and column definitions: README.txt.
Press contact
Questions, a different cut of the data, or a comment for a story: Press Office
How we worked it out
Each base has its own table, built the same way from real records. For every night from September to April we used weather-service cloud records to see whether the sky was clear, and geomagnetic activity data to see whether the aurora was active, then asked how often a trip of one to five nights would have caught at least one good night. Good night = at least 2 hours that were dark (sun more than 12 degrees below the horizon), clear (cloud 25% or less, 2 oktas) and active (Kp 2 or more). A trip window of k nights is a success if any of its nights is good, over every start date in September to April, so overlapping windows are used on purpose and nights are never treated as independent of each other. A night with a missing dark-period hour is excluded, and so is any window containing it; gaps are never filled.
Every number is a count of real past trip windows divided by the number of real past windows. The brackets in each table show how many windows sit behind each figure. The single-winter range shows the worst and best single winters for three-night stays, so you can see how much a month varies from year to year.
This is a record of how often the sky has cooperated in past winters. It promises nothing for any one night.
Data credits
- Abisko cloud: SMHI open data, total cloud cover (parameter 16, hourly), Abisko Aut, quality-controlled archive. Source: SMHI. Licence CC BY 4.0 SE. Modified: selected hours, thresholded and combined with other data.
- Kp: GFZ German Research Centre for Geosciences, Potsdam, Kp index (definitive values), CC BY 4.0, doi:10.5880/Kp.0001. Modified: thresholded. The sunspot column is not used.
- Sun position: NOAA general solar position equations (about 0.1 degree).
- Tromsø cloud: MET Norway, hourly total cloud cover in oktas (cloud_area_fraction), downloaded from the MET Norway Frost API (frost.met.no). Licence CC BY 4.0. Modified: selected hours, oktas converted to percent, thresholded and combined with other data.
- Rovaniemi cloud: Finnish Meteorological Institute (FMI) open data, hourly total cloud cover in oktas (TotalCloudCover), downloaded from the FMI open data WFS service (opendata.fmi.fi). Licence CC BY 4.0. Modified: selected hours, oktas converted to percent, thresholded and combined with other data.
- Saariselkä cloud: Finnish Meteorological Institute (FMI) open data, hourly total cloud cover in oktas (TotalCloudCover), downloaded from the FMI open data WFS service (opendata.fmi.fi). Licence CC BY 4.0. Modified: selected hours, oktas converted to percent, thresholded and combined with other data.
- Data pulled: Abisko 16 Oct 2026; Tromsø 17 Oct 2026; Rovaniemi 16 Oct 2026; Saariselkä 16 Oct 2026.
What travellers say: a second dataset
This one is different from the Odds above. It counts what travellers wrote in published reviews, so it describes reviewers, not the sky.
Base: 1,412 published traveller reviews we analysed, posted Jan 2023 to Oct 2026. Question: reviewers who said whether they saw the lights, by the month they travelled.
December covers trips from 2023 to 2025 only, and the confidence band is roughly 72% to 89%. 102 of the 130 February reviews are from 2026 trips.
This describes reviewers, not your chances of seeing the lights, and it says nothing about the sky.
Method: from published traveller reviews posted Jan 2023 to Oct 2026 we kept the 1,412 about a Northern Lights trip in the aurora season, then counted the reviewers who said whether they saw the lights, by the month they travelled. An independent reader checked a sample of the coding and recomputed every count.
Put this month's odds on your site
A small card showing the month's figure for three-night stays at one base. No script, no tracking, one visible credit link back to this page.
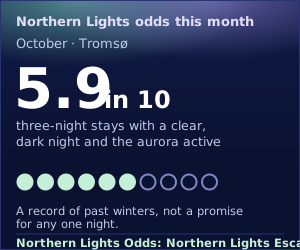
Copy this into your page (shown for Tromsø; the other bases are listed below):
<iframe src="https://northernlightsescapes.co.uk/press/widget.html" width="300" height="250" title="Northern Lights odds this month" loading="lazy" style="border:0;max-width:100%"></iframe>
Fits from 260px wide up to 340px. If your site will not take an iframe, download the picture version and link it to this page.
Cards for the other bases
<iframe src="https://northernlightsescapes.co.uk/press/widget-abisko.html" width="300" height="250" title="Northern Lights odds this month" loading="lazy" style="border:0;max-width:100%"></iframe>Picture version (SVG)
<iframe src="https://northernlightsescapes.co.uk/press/widget-tromso.html" width="300" height="250" title="Northern Lights odds this month" loading="lazy" style="border:0;max-width:100%"></iframe>Picture version (SVG)
<iframe src="https://northernlightsescapes.co.uk/press/widget-rovaniemi.html" width="300" height="250" title="Northern Lights odds this month" loading="lazy" style="border:0;max-width:100%"></iframe>Picture version (SVG)
<iframe src="https://northernlightsescapes.co.uk/press/widget-saariselka.html" width="300" height="250" title="Northern Lights odds this month" loading="lazy" style="border:0;max-width:100%"></iframe>Picture version (SVG)
Thinking of going yourself? Tell our travel team where and roughly when, and they plan the trip with you.
Tell us about your trip